
You told us rankings moved and sales didn’t, so we did not come back with another SEO retainer. We went looking for why — and the answer turned out to be bigger than search. The question worth answering is how Bibado becomes the most authoritative commercial voice on developmental feeding in the UK, at which point AI visibility, rankings, citations and PR are outcomes rather than objectives.
“Bibado vs Tidy Tot”
“best weaning bib”
“which brands are experts in baby-led weaning”
“how do I get my baby to self-feed”
Rankings moved. Sales didn’t. The brief, in one line
That’s a reasonable conclusion from what happened. It’s also the reason we didn’t want to come back with the same thing under a new name.
Bibado already has what most brands spend a decade trying to build. A King’s Award for Enterprise. Endorsements from dietitians, occupational therapists and early-years specialists. Thousands of five-star reviews. Roughly one in six UK families — your own figure. A genuine patent.
So the question worth answering isn’t how do we get more rankings. It’s this:
Does AI understand Bibado as the authority on weaning and self-feeding — or as a company that sells bibs?
Every finding in this document points at one thing, and it isn’t a search problem. Bibado has built its products around a developmental argument, and that argument is currently being made more loudly by other people.
Doddl wins “best first cutlery” by arguing that pincer grip leads to pencil grip leads to writing at school. That is Bibado’s argument. It is the reason the Coverall has sleeves, the reason Dippit is shaped the way it is, and the reason you talk about the first thousand days. Somebody else is using it to win the answer, because they have externalised it and you have not.
| Bumkins | A bib |
| ezpz | Feeding products |
| Doddl | Developmental cutlery |
| Stokke | The mealtime environment |
| Bibado | A bib — and an unclaimed idea |
The territory nobody has taken is the one Bibado designs for: what happens to a child developmentally when they are allowed to feed themselves. It is broader than bibs, narrower than weaning, and it is the only one where your product range already reads as a system rather than a catalogue.

Nothing here needs inventing. It needs saying out loud, in public, in a form other people can cite.
Not mess management. Permission — the thing that lets a parent stop intervening and let a baby explore food with their hands.
Not a spoon. A first tool for autonomous interaction with food, sized for a fist before a pincer grip exists.
Not cutlery. The transition — built around the hand a child has now, not the one an adult has.
Not a cup. Independent drinking, which is a motor milestone before it is a product category.
Not tableware. An environment for participation — a surface that stays put while a child works out what their hands do.
A system with a developmental order to it. That order is the thing worth owning, and it is what a search engine, a dietitian and a parent can all repeat.
We would rather Bibado become an authority an engine would produce a worse answer without, than a brand that has been optimised into a recommendation slot. Those need different work, and only one of them compounds.
Fifty prompts, written the way a parent types them, put to three AI engines at UK locale. Every answer recorded with its citations. Run blind, before we looked at your site or your analytics, so nothing we already believed could colour it.
A note on honesty: these are the engines' official APIs, not the consumer apps — no personalisation, no chat history. That makes the baseline reproducible month to month, which is what you want for measurement, but it isn’t literally the screen one specific parent sees. We’d rather say so than let the number carry more weight than it earns.
This is the whole diagnosis in one chart. Ask AI about Bibado and it answers beautifully. Ask it the question a parent actually starts with, and you are effectively not there.
On the questions parents actually begin with — the problem, not the product — Bibado appears in 7% of AI answers. Across all unbranded discovery it’s 33%. Below we test that against your competitors on the same questions — and against ourselves, because two of our own numbers needed correcting once we did.
A note on that authority figure, because it’s the one we’d most expect you to interrogate. Half our authority prompts named Bibado directly — “has Bibado won any awards” — and those score 100%, which measures recall rather than authority. The 44% above counts only the prompts that don’t mention you: “which brands are experts in baby-led weaning”, “who are the leading experts on baby self-feeding”. That’s nine answers, so treat it as indicative. It’s also the number that answers the question we opened with — AI is slightly readier to name you for a product than as an authority.
We checked whether this is just an artefact of the model tier. Twenty of the prompts were re-run on the current top tier of all three engines — a full generation newer than the first pass. The result was identical: 36 of 60 answers named Bibado on both. Four answers flipped, two each way. So if you open ChatGPT during this meeting and ask one of these questions, you should get roughly what we got. Please try it.
We asked all three engines “how do I encourage my baby to self-feed?” — the question sitting at the exact centre of everything Bibado stands for. First thousand days, motor skills, confidence at the table.
All three engines answered it without naming a single brand. And the sources Perplexity drew on were Stonyfield, Enfamil, BabyBjörn and What to Expect — a yogurt brand, a formula brand and a highchair maker. Their content is the raw material for the answer. Bibado’s isn’t.
A number is only a gap if somebody else is filling it. So we ran every competitor through the same 150 answers — and then we checked whether the comparison was fair, which turned out to matter more than the comparison.
First, the honest correction. Twelve of our fifty prompts contain the word “Bibado”, and you are named in all 36 of those answers. No competitor gets that advantage. So the like-for-like table is the unprompted one — the 114 answers where nobody put your name in the question.
| Named unprompted | Share of 114 answers |
|---|---|
| Bibado | 33% |
| Bumkins | 21% |
| ezpz | 20% |
| Munchkin | 15% |
You are still first, by twelve points rather than the thirty-two the prompted number would have shown you. That is the number we would defend.
In 45 of the 54 problem-question answers, no engine names any brand at all. Thirteen of the eighteen problem prompts — “how do I encourage my baby to self-feed”, “how do I manage the mess when weaning”, “when can my baby use cutlery” — return zero brands from anyone, us or your competitors. That isn’t a contest you are losing. It is an answer format with no brand slot in it, and no amount of money changes that.
| The 9 problem answers that do name brands | Named in |
|---|---|
| ezpz | 67% |
| Stokke | 67% |
| Munchkin | 56% |
| Bibado | 44% |
| Bumkins | 44% |
This is the real target, and it is narrower and more winnable than “win the problem questions”. Five problem prompts out of eighteen produce brand answers — three list-shaped, two how-to. On those you are fourth, named in 44% against ezpz and Stokke at 67%. That is a gap you can close.
How this is counted, and what we will not claim from it. The measure is whether a brand name appears anywhere in the answer, applied identically to us and to everyone else, so it is presence, not endorsement. Nine answers is a small base and run-to-run variation on an instrument like this is real — our own model-tier re-run moved four answers of sixty with no intervention at all. So we would treat the 44% as a direction to work in, not a scoreboard, and we would rerun the whole set on demand for any competitor list you name. The competitor rows shown are the ones you named on the call; the full run covers fifteen brands.
Bibado is competitive on bibs. On every other category — the cutlery, the cups, the tableware — it loses outright, to the same two or three names. That’s the higher-AOV attach range, and the one whose developmental story is closest to Bibado’s own.
| Question | Bibado | Named instead |
|---|---|---|
| Best open cup for babies | 0 of 3 | ezpz, Olababy, Munchkin |
| Best suction plate for a baby | 0 of 3 | ezpz, Bumkins, Munchkin, Vital Baby, Stokke |
| Best first cutlery for babies | 0 of 3 | Olababy, Doddl, Grabease, Nuby, Munchkin |
| Best spoon for a baby learning to self-feed | 0 of 3 | ezpz, Olababy, Grabease, Munchkin |
| Best baby tableware set UK | 1 of 3 | ezpz, Mushie, Munchkin, Tommee Tippee, BabyBjörn |
| Best baby feeding set for starting solids | 1 of 3 | Bumkins, ezpz, Olababy, Bapron |
ezpz and Olababy own the self-feeding tools conversation. Doddl wins “best first cutlery” by arguing that pincer grip leads to pencil grip leads to writing at school — which is Bibado’s own developmental argument, being used by someone else to win the answer.
On 11 of the 50 prompts the engines disagreed — one named Bibado, another didn’t, on the identical question. That’s a brand sitting right at the cut line. It’s a far better position than invisibility, because small movements in the citation layer should flip several of them.
Every answer below is verbatim from the engine’s API on 8 September 2026, trimmed for length. Nothing is paraphrased.
We logged the sources cited across the 76 answers that returned readable domains — every Perplexity answer and 26 of ChatGPT’s. Gemini cites behind Google redirect wrappers that mask the domain, so it contributes nothing here and we’ve excluded it rather than guess. The domain appearing in the most answers isn’t a publisher, a retailer or a brand. It’s Reddit — in 66 of those 76 answers, against bibado.co.uk’s 37.
Reddit is the most-cited domain in the category — ahead of every individual publisher, and ahead of bibado.co.uk. A digital PR plan aimed only at journalists covers part of the surface. Community presence is a lever you’re unusually well placed to pull, with thousands of genuine advocates already talking about you.
bibado.co.uk is the second most-cited domain in the category. Your own content is being read and used by these engines. The problem isn’t that AI can’t find you — it’s that you don’t own the unbranded answer. Trustpilot (11 and 9 across its two hosts) and John Lewis at 14 say reviews and retail feed the answers too.
Sixteen months of Search Console. Four million impressions, and 2.4 million of them on non-brand terms. The demand exists — Google is already showing Bibado to people asking. What isn’t happening is the click.
On the questions parents ask, Google showed Bibado 55,166 times and got 233 clicks. The visibility is already bought and paid for. It just isn’t converting into a visit.
The first thing anyone says to that number, and a fair challenge. So we controlled for it properly: matched on query class, with off-category traffic and your own brand misspellings removed, and restricted to queries carrying real volume.
| Google position | Queries | Impressions | Your CTR | Curve | You earn |
|---|---|---|---|---|---|
| 1–2 | 98 | 28,756 | 2.47% | 13.2% | 0.19× |
| 3–4 | 395 | 222,051 | 1.81% | 7.3% | 0.25× |
| 5–7 | 920 | 578,796 | 1.21% | 3.6% | 0.33× |
| 8–10 | 641 | 441,552 | 0.58% | 2.2% | 0.27× |
| 11–14 | 416 | 492,324 | 0.34% | 1.4% | 0.23× |
| 15–20 | 268 | 168,660 | 0.19% | 1.0% | 0.20× |
| Branded | 170 | 332,949 | 13.08% | 18.1% | 0.72× |
Why the filtering matters, since it changes the answer. Run this on the raw
non-brand set and the 1–2 row comes out at 0.08× of curve — a number so
extreme it should be distrusted, and it should be. 37% of that band’s impressions
come from 6,469 queries with a median of one impression each: “how to cook
sweet potatoes”, “plum juice”, a site: operator, and more
misspellings of your own name. Restricted to the 98 queries carrying 50 impressions or
more, the defensible figure is 0.19×. The finding survives. The alarming version of
it did not deserve to.
An average position in Search Console is not a position on the page. On your two highest-volume non-brand terms, this is what actually sits above you.
Position one is an AI Overview carrying eleven sources — John Lewis, Emma’s Diary, Ella’s Kitchen, SR Nutrition, Natural Baby Shower, Vital Baby, Tommee Tippee, Mamas & Papas. Bibado is not one of them. Your collection page is the first organic result underneath it. Below that: three Reddit threads, eight shopping listings, a Mumsnet discussion, the NHS.
You are the number one organic result. Between it and the top of the screen sit roughly twenty-nine shopping listings — Vital Baby, Tommee Tippee, Munchkin, Nuby, Doddl — and a People Also Ask block. Three of those listings are yours, which is the good news. Being first is no longer the same as being seen.
So this is not a copywriting problem, and we are not going to sell you one. It is the page being rebuilt above you — by an AI Overview that cites eleven sources and omits you, and by shopping surfaces that answer before the blue links begin. The remedy is the same in both cases: become one of the sources being cited, rather than the result underneath the thing doing the citing.
The curve is a blended desktop-and-mobile organic click curve of the kind published by Advanced Web Ranking and Sistrix. Read the levels loosely and the shape closely: the ratio holds between 0.19× and 0.33× at every position while branded runs at 0.72× in the same account. SERP anatomy pulled live from Ahrefs on 9 September 2026, en-GB, and cached with the rest of the workings.
But we checked that against external volume data, and it complicates the story in a way worth being straight about. Those 55,166 impressions are spread across 5,049 separate queries — about eleven impressions each. And the exact phrasings barely register: “how to encourage baby to self feed” has a UK search volume of zero.
Which is the argument for AI, not against it. Questions with no measurable keyword volume are exactly the ones people now ask an assistant instead of typing into Google. The demand didn’t disappear — it moved to a surface keyword tools don’t measure. Those exact phrasings have no parent topic in Ahrefs at all — the tool has nothing to attach them to. The subject does: “weaning” and “starting solids” both roll up to the parent topic “weaning baby”, at 14,000 monthly traffic potential, and “baby weaning” carries another 10,000. The topic is large, the phrasings are not, and the tool cannot connect the two. That gap is the whole opportunity.
Sixteen months lets us compare like for like. Summer 2026 against summer 2025:
Non-brand organic is growing about 20% a year. Branded search is shrinking 15%. Which says two things. The non-brand work isn’t failing — it’s compounding, slowly, from a small base. And the brand demand that currently carries two-thirds of your organic clicks is softening, so the thing propping the channel up is the thing declining. That is an argument for acting now rather than a reason to wait.
June–August each year, so seasonality is matched. Branded is measured by queries containing your name; total is the site figure including the queries Google won’t name.
One caveat we’d rather state than bury: Google anonymises 37.5% of Bibado’s clicks, and the queries it hides are the rare, long-tail, non-brand ones. So the branded share is an upper bound on the queries Google will name for us — the real figure is likely lower, which makes the non-brand opportunity larger, not smaller.
We joined Search Console to GA4 to answer the only question that matters after last time: which organic landing pages actually make money.
Revenue per organic session by site section, 16 months.
The informational estate takes 11.5% of organic sessions and returns 0.56% of attributable revenue. Eleven thousand six hundred and eighty-seven sessions produced twenty key events. It converts 33× worse than the commercial estate.
It’s an argument against content that doesn’t lead anywhere. The FEED hub earns its traffic — it just has no commercial path out of it, and no structure that lets an engine quote it. Both are fixable without writing a single new article.
It is last-click revenue on the landing page. Informational content almost never converts last-click — that is how content works, not a Bibado fault, and an assisted-conversion pull would raise it. We haven’t run one, so treat this as the floor. Nothing below rests on it: the AI-landing evidence is the stronger version of the same argument and doesn’t use last-click at all.
Half your organic revenue — £112,342 across 29,988 sessions — can’t be tied to a landing page at all. GA4 records the page from inside Shopify’s pixel sandbox, so the path is lost. Everything above is a share of the half we can see. And separately, around a third of your revenue is Amazon, invisible to GA4 entirely — so content driving an Amazon purchase scores nothing here. Both worth fixing regardless of who you work with.
We looked at AI answers, Search Console and GA4 separately, expecting three different stories. They turned out to be the same one.
| Where we looked | What we found | The number |
|---|---|---|
| AI answer engines | Named on problem questions | 7% |
| Google, question-intent searches | Shown 55,166 times, clicked 233 | 0.42% |
| GA4, informational landing pages | 11,687 sessions, 20 key events | £0.05 |
Bibado is present but not chosen — and when chosen, not converted. Google shows you and people scroll past. AI reads your site and recommends someone else. The traffic that does arrive lands somewhere with no route to a product. Same failure, three surfaces.
Which is why we’d treat this as one piece of work rather than an SEO project and an AI project. The fix for “AI won’t recommend us” — answerable content, machine-readable expertise, corroboration where engines actually read — is substantially the same fix as “Google shows us and nobody clicks”.
One query shows the whole thesis. On “open cup for baby” your Search Console shows the Sippit page averaging position 4.2 across 7,365 impressions — top-five in Google, earned. Ask ChatGPT, Perplexity and Gemini the two open-cup questions a parent actually types and Bibado is named in none of the six answers; they recommend ezpz, Olababy and Nuby. Top five on the old surface. Absent from the new one. Same product, same page, same month.
AI referrals are 980 sessions out of 1,121,082, worth £1,561 across 43 purchases. ChatGPT is 932 of them. (By referral source the total is 979 — one ChatGPT session has no recorded landing page, so the two GA4 reports differ by exactly that one.) That is a floor, not a channel, and we’d rather you heard it from us now than discovered it in month four. The case for acting isn’t today’s number — it’s that the same work moves the classic-search numbers above, which are large.
The question-intent layer. It has 55,166 impressions already earned, a 0.42% click-through, and it’s the same content AI declines to quote. It’s the one place where classic search and AI visibility are the identical job.
We can now see the landing page for every AI referral. The pattern is unambiguous, and it sharpens the content finding considerably.
Share of the 761 AI
referrals whose landing page is recorded. A further 219 land on the pixel sandbox
root and can’t be attributed. Two notes before you check any of this yourself. This
page uses two different GA4 counts and they are not interchangeable. The funnel and the
session totals are session_start events — 1,121,082, and it sums to exactly
that by channel and by device. The revenue-per-session and AOV figures use GA4’s
sessions metric, 1,097,003 for the same window, because GA4 counts the two
differently. Each measure is internally consistent; we are naming which is which so you
can reconcile them rather than trip over them. And we count 980 AI sessions by
filtering referral sources (ChatGPT, Gemini, Perplexity, Copilot, Claude). GA4’s own
“AI Assistant” channel shows 450 sessions and £750 over the same window because it
groups them differently. Both are right; ours is the wider net, and we’d rather point
at the gap than have you find it.
Four in five AI referrals land on a product page. Twenty-two land on the blog — 3% of the 761 we can attribute. So the assistants already recommend Bibado products by name and send people straight to them. What they never do is cite the content. Your informational estate isn’t just failing to convert — it isn’t the thing AI reads in the first place.
That’s the clearest statement of the whole problem we have. The products can be found and recommended. The expertise — the FEED hub, the dietitian pieces, 475 posts averaging 2,027 words — is not part of the conversation at all.
You have already written the answer to one of the biggest questions in the category. Here is what happened to it.
The content isn’t the problem. Its findability is. “Your Weaning
Checklist” answers what do I actually need for weaning — and Google has given
it 407 impressions and not one click. And next door, on the collection page rather than the post,
the same pattern with volume behind it: “weaning essentials” brings
/collections/weaning-essentials 12,774 impressions at position 3.1 — and
131 clicks, a 1.0% click-through from the top of page one. Third in Google and
still unchosen. Whichever page type we look at, being found is not the constraint.
You asked for the drop-off view, split by channel and device. Here it is across 1.1 million sessions. Your add-to-cart rate is excellent and your checkout completion is respectable. Between those two sits the whole problem — and it sits there for organic exactly as it does everywhere else.
Your checkout is not the problem. Sessions to purchase runs at 5.88% sitewide — above the figure you quoted us — and once a parent starts checkout, 52.3% of them finish. Those two are session-clean and healthy. The middle of this funnel we will not quote at you: add-to-cart fires once per item and checkout once per order, so the ratio between them is 3.4 to 1 on arithmetic alone and says nothing about abandonment. A real abandonment rate needs a session-scoped pull we have not run. Your constraint is who arrives, not what happens to them.
Split by channel, the shape is the same everywhere. What isn’t universal is what happens before it.
| Channel | Sessions | Add to cart | Reach checkout | Session → purchase | AOV |
|---|---|---|---|---|---|
| Paid Search | 120,963 | 40.6% | 27.4% | 10.35% | £37.21 |
| Direct | 150,998 | 39.9% | 33.5% | 6.74% | £38.50 |
| Organic Search | 104,736 | 36.0% | 29.0% | 5.56% | £38.77 |
| Mobile (all traffic) | 1,053,185 | 38.1% | 29.5% | 5.87% | — |
| Desktop (all traffic) | 61,326 | 38.4% | 26.8% | 6.13% | — |
Organic converts at 5.56%. Paid search converts at 10.35%. Same site, same checkout, same basket step — nearly double the conversion. Paid visitors also view 1.5 products per session against organic’s 1.0. The difference isn’t the shop. It’s that paid arrives knowing what it wants and organic doesn’t.
And when organic does buy, it spends the most. £38.77 average order value — higher than paid search, direct, email or paid social. Your organic customers are your best customers. There simply aren’t enough of them arriving with intent.
Measurement note: the add-to-cart and reach-checkout columns are GA4 event counts, not session counts — one session fires several add-to-cart events but begins checkout once. Comparing channels is sound because every channel is measured the same way; the absolute rates are not, which is why we don’t quote them.
That you have a conversion problem. You don’t. 38% add-to-cart is strong, mobile reaches purchase in 5.87% of sessions against desktop’s 6.13% — no meaningful device gap — and 94% of your traffic is mobile and performing. We’d rather name the one real leak than invoice you for a CRO retainer.
Organic search delivers £2.25 per session against paid search’s £3.89 and direct’s £2.69 — eighth of sixteen channels. The issue isn’t that visitors don’t buy. It’s which visitors are arriving, and what they were looking for when they did.
We grouped every non-brand query into the product and intent lines you actually sell against, then attached what each one earns and how often AI names you. Together they carry 1.6 million impressions at a 0.81% click-through.
| Cluster | Impressions | CTR | Avg pos | Revenue | AI names you |
|---|---|---|---|---|---|
| Plates, bowls & tableware | 390,888 | 0.85% | 11.5 | £10,014 | 22% |
| Everyday & dribble bibs | 363,928 | 0.46% | 13.1 | £9,719 | 86%* |
| Cutlery & self-feeding tools | 251,051 | 0.93% | 9.1 | £4,925 | 21% |
| Coverall & weaning bibs | 228,666 | 0.92% | 10.0 | £37,148 | 86%* |
| Cups & drinking | 170,403 | 0.69% | 13.1 | £3,318 | 0% |
| Off-category traffic | 109,410 | 1.34% | 17.1 | £72 | — |
| Weaning guidance & charts | 77,340 | 0.97% | 12.2 | £2,069 | 33% |
| Mess & mealtime problems | 3,923 | 0.31% | 15.1 | £63 | 27% |
Non-brand queries only. Revenue is GA4 organic revenue on the pages Google ranks for that cluster, each page credited to the one cluster it earns most impressions in so nothing is counted twice. It is all organic revenue on those pages including branded visits, so treat it as the scale of what the cluster touches rather than what non-brand search earns. Every Ahrefs figure on this page — volumes, traffic potential, parent topics and domain ratings — was pulled on 8 September 2026 and is cached with its endpoint and response, so you can ask us to show the working on any of them. “AI names you” is the share of matching answers where an engine mentioned Bibado, matched on prompt wording rather than a true join — treat it as indicative. *The two bib rows resolve to the same 21 bib answers, so they carry one figure between them, not two independent readings. Cups and tableware rest on two and three prompts respectively — small samples, flagged rather than smoothed over.
Read the cutlery row. It’s your best-ranking cluster — average position 9.1 — and it earns £4,925 while AI names you on one prompt in five. You rank, nobody clicks, and the machines recommend Olababy and ezpz instead.
The coverall cluster. AI knows you and it earns £37,148 — more than every other cluster combined. Ahrefs groups “weaning bib” under the branded parent topic “bibado bib”, which tells us those terms are low-volume and ambiguous enough that your own page is what ranks for both. Useful to know; not proof that Google reads you as the category.
Cups. 170,403 impressions, position 13.1, £3,318, and not one of six answers named Bibado. Sippit exists and neither Google nor the engines associate it with you.
Plates, bowls and tableware — 390,888 impressions and £10,014. The suction bowl alone takes 193,388 impressions. Highest demand, close to the lowest return.
One cluster we’d tell you to leave alone. “Baby bibs” and “bibs” carry 168,343 impressions between them, but the UK results are a retailer shelf — Next at 79, Asda at 81, M&S and John Lewis at 82, plus shopping listings from Tu, Matalan and George. That is not a page-ownership problem, it’s a SERP you can’t buy your way into. We’d rather say so than sell you the biggest number on the table.
Cutlery is the opposite — and it’s winnable. “Baby cutlery” is won by munchkin.co.uk at domain rating 28 and doddl.com at 32. Bibado sits at 29, in position seven with a collection page. (Munchkin’s US domain is DR 66 — it isn’t what ranks here.) You are not being outgunned on authority here; you’re being outranked by peers. And this is the cluster AI ignores you on four times out of five.
On the head terms the page Google ranks isn’t a category page — it’s the homepage, and it ranks badly. That’s a different problem from having too many pages, and a more fixable one.
| Query | Pages competing | Page Google picks & its position |
|---|---|---|
| baby bibs · 83,045 impr | 20 | homepage position 13.9 |
| bibs · 85,298 impr | 20 | homepage position 13.8 |
| baby bib · 25,632 impr | 26 | homepage position 12.0 |
| weaning bibs · 22,372 impr | 28 | collection position 2.9 |
Note that page count isn’t the driver — “weaning bibs” has the most competing pages of the four and the best position. What separates them is which page Google chose. A purpose-built collection ranks 2.9; the homepage standing in for a category ranks 13.9. Giving each question a page built to answer it is the same work as making the category legible to an AI engine.
One more from the same data: off-category recipe and unrelated traffic pulls 109,410 impressions at the highest click-through on the site — and £72. Rice krispie cakes and breastfeeding cover alone account for 28,188 of it. Off-category traffic landing on content with no route to a product, which is part of why the blog earns five pence a session.
We crawled all 902 URLs with a real browser and mapped every internal link. Twenty-eight collection pages are orphaned. Seventeen of those are dead campaign pages that should be — Christmas sales, influencer drops, a page literally called jbtest. Eleven are evergreen collections carrying 338,911 impressions between them.
| Orphaned evergreen collection | Impressions | Clicks | Position |
|---|---|---|---|
| /collections/dribble-bibs | 252,277 | 2,085 | 11.7 |
| /collections/bibado-tableware-collection | 43,940 | 522 | 7.9 |
| /collections/all-bibado-products | 33,115 | 105 | 6.5 |
| /collections/parent-weaning-resources | 3,718 | 91 | 13.6 |
| plus seven bundle collections | 5,861 | 60 | — |
This is the mechanism behind the ranking problem. The two clusters with your worst click-through — dribble bibs at 0.46% and tableware at 0.85% — are exactly the two whose collection pages have no internal links pointing at them. Collections are the page type that wins category terms: your “weaning bibs” collection ranks 2.9 because it’s linked and owns the query. The dribble bibs collection ranks 11.7 on a quarter of a million impressions because nothing points at it.
Worth saying plainly: this is probably the cheapest win on the page. Adding internal links to eleven collection pages is a contained piece of work on pages that already have the impressions.
The obvious hypothesis is that the blog sits in a silo. It doesn’t. 472 of 475 blog posts link to at least one product or collection, averaging twenty such links each. No blog page is orphaned. Whatever is wrong with the content’s commercial performance, it isn’t the internal linking — so nobody should be paid to fix that.
Collections and standalone pages. 28 of 46 collections and 19 of 37 pages have no internal links at all. The blog links down to products enthusiastically and across to collections almost never — the opposite of where most agencies would point you.
The engines answer accurately when a parent types “Bibado”. The retrieval layer underneath them is a different story, and it’s a smaller, stranger problem worth fixing first.
Ask the web “is Bibado worth it?” and four of the first ten results are about Bilbao, Spain. Travel guides — not competitors, not reviews. The brand token is being partially resolved to a city. For a brand whose entire AI problem is being recognised as an authority, having the name itself contested is the wrong place to start from.
Your homepage carries an Organization block with exactly three
things in it: a name, a URL, and links to Facebook, Instagram and TikTok. No
description, no logo, no founder, no founding date, no King’s Award, no Companies
House or Wikidata reference. Nothing in the markup says British weaning brand
rather than possible typo for a Spanish city. We checked the live page —
this is what’s there today.
It is one block of JSON-LD, specified once and shipped on one template. Entity disambiguation is the groundwork every other AI recommendation here sits on: an engine that isn’t sure what Bibado is has no basis for naming you when a parent asks who the experts are. Small, and it is the groundwork the rest sits on.
The Bilbao result is from a nine-prompt DuckDuckGo check, so treat it as an illustration rather than a measurement. The schema gap underneath it is verified live and is true regardless.
902 pages, rendered. Most of it is healthy; these are the things worth a developer ticket.
53 titles are shared across 456 crawled URLs. Much of that is variant query strings of the same page, so the page-level number is smaller — but the real cases are there: the long-sleeve Coverall title sits on at least five distinct product URLs. On terms where you rank 11–14, the title is most of what decides the click.
117 of 337 crawled product URLs emit more than one H1 — 44 unique product paths behind them, so this is one template fault repeated, not 117 jobs. A theme-level fix.
The Coverall page serves two Product blocks with two
AggregateRating blocks and two different review counts — 1,849 and
3,300. Verified in the live raw HTML three times, most recently today. Our rendered
crawl doesn’t reproduce it because the browser deduplicates; the non-rendering
crawlers that several AI engines use read the raw source, and get both.
view-source: on that page and search reviewCount — it’s
two lines apart.
30 internally-linked URLs return 404, among them /products/bamboo-bowls
(114,900 Search Console impressions, 1,293 clicks, position 8.9) and /products/baby-cutlery — a
product in the range AI already won’t recommend you for.
FAQPage appears on 4 pages of 902 and HowTo on none. These are the structures engines lift answers from, and they’re effectively unused across 475 blog posts.
136 blog posts have no meta description, 48 collections likewise. 329 blog titles are under 30 characters.
864 of 902 return 200. Canonicals present, no unintended noindex, robots.txt allows every AI crawler, and the hreflang cluster across .co.uk, .com and en-au validates.
BreadcrumbList on 896 pages, BlogPosting and Person on 378, Product with Offer, Brand and AggregateRating on 324. The groundwork is there to build on.
The sitemap lists 482 UK URLs; crawling links finds 902. A large share of the gap is variant query strings of pages already listed — worth confirming which, and deciding whether the rest should be indexed.
One finding we tested and discarded, because you should know what didn’t survive as well as what did: that AI names you when it searches and forgets you when it doesn’t. It looked compelling and it didn’t hold — the effect was mostly which prompts the engines choose to search on. A sampling shortcut in our own first pass on internal linking went the same way once we crawled the site properly. Expect us to bin our own findings when the data says so.
If the objective is category authority rather than search visibility, then these are the questions the strategy is judged on. We would answer all six in the first phase, and we would expect to be held to them.
What precise territory does Bibado own? “Weaning” is too broad and somebody already owns it. “Bibs” is too narrow and you already own it. Our starting position is developmental self-feeding — but the phrase matters less than agreeing the boundary and then never straying from it.
Fifty prompts was a diagnostic sample, not a map. The real unit is the parent journey — when to start, exploration, mess, grasping, utensils, drinking, picky eating, independence — sized by demand and by what each territory is worth commercially, so effort follows money rather than volume.
What evidence would make Bibado legitimately authoritative? Named experts, original studies, product-testing data, a published developmental framework, professional partnerships. Authority you can cite, not authority you assert.
How that authority travels beyond bibado.co.uk — to publishers, practitioners, retailers and communities. This is the part that matters most and the part most agencies skip, because the sources AI retrieves from are almost entirely third-party.
A deliberate bridge from question to understanding to the relevant developmental tool to the product — without turning an educational asset into an advert, which destroys the citation value that made it worth building.
AI presence is a leading indicator, not the objective. The chain we would report on is non-brand discovery, then qualified visits, then product exploration, then revenue and repeat rate — with AI visibility and citation share sitting underneath it as diagnostics.
There is a causal story available here that we are not going to tell you: add Organization schema, FAQ markup and internal links, and the engines will start recommending Bibado. We do not believe that, and our own data is the reason. The domains feeding these answers are Reddit, Mumsnet, MadeForMums, dietitians, retailers, Trustpilot and the NHS. The authority graph is almost entirely outside your website.
Machine comprehension, page relationships, and the recovery of demand you have already earned — 338,911 impressions sitting on unlinked collections and 114,900 on a product URL that returns 404. Those are worth doing on their own merits, today, whoever does them.
It does not make an engine decide you are the authority. That is earned in other people’s sources over months. Anyone who tells you a JSON-LD block moves recommendation rates is selling you the easy half of the job.
So the four-week block is not a causality test. Re-running the 150 prompts afterwards gives you an after-baseline for the 90 days — not evidence the four weeks worked. We would rather say that now than have you infer it from a chart later.
Reddit appears in 66 of the 76 answers that return readable sources. It is the single largest lever in this document, and it is also the one most capable of doing you damage. So here is the operational answer, in advance of being asked.
Agency-run accounts. Posts written as parents. Seeded recommendations, incentivised reviews, or anything disguised. Beyond the reputational risk, subreddit moderators remove brands that do it and the ban is permanent — on the exact surface this document says matters most.
Read the conversations properly and tell you what parents actually ask and complain about. Give your team, named and identified as Bibado, the material and the rules to take part where brands are welcome. Earn mentions the ordinary way: research worth writing about, experts worth quoting, and a product story worth repeating. You have thousands of real customers — the job is to give them something to say.
If that sounds slower than buying presence, it is. It is also the only version that survives contact with a moderator, a journalist or a customer.
That is not an argument for publishing more. It is an argument that 475 fragmented pieces are doing the work of about thirty definitive ones. We would rather own the definitive resource on how babies learn to self-feed — with your experts, your first-party data, your product design rationale and original research in it — than add another thirty articles to an estate nothing cites.
Consolidation is the cheapest authority work available to you. The traffic, the expertise and the evidence already exist — they are just spread too thin for anyone, human or machine, to cite.
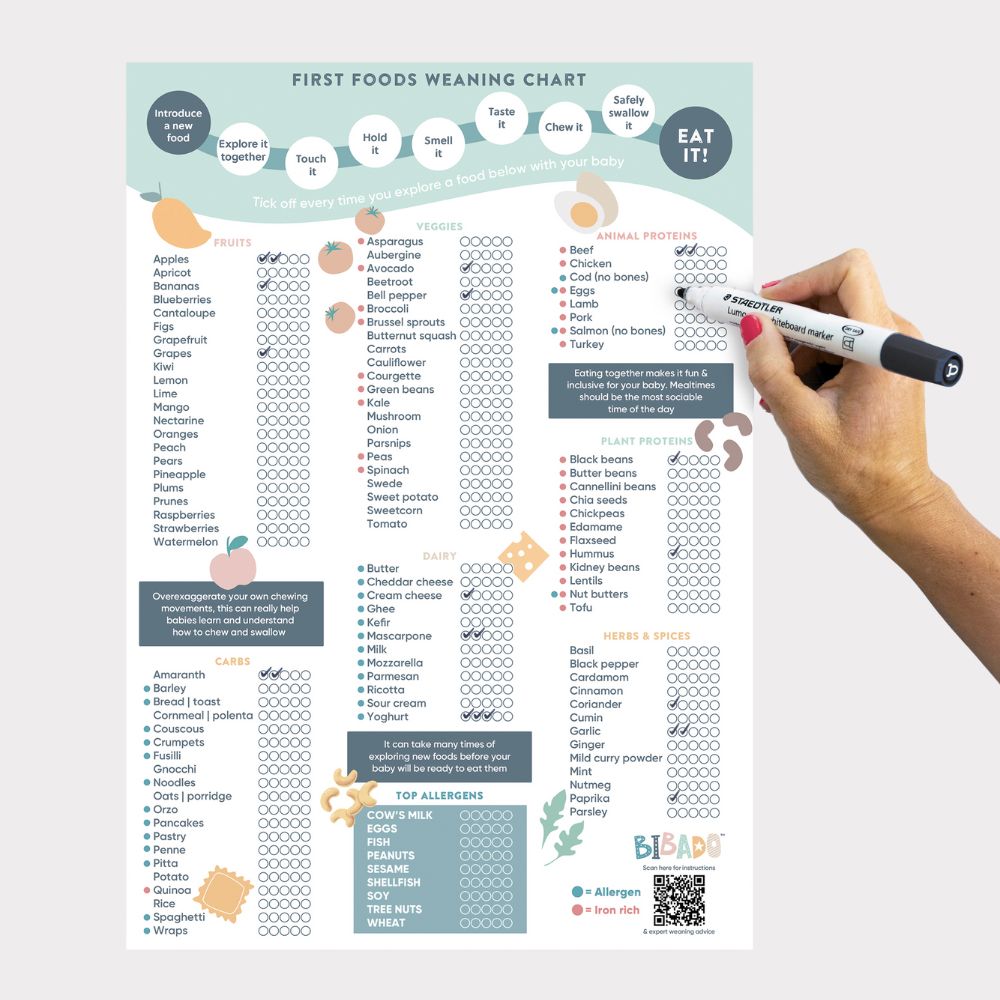
Your First Foods Weaning Chart is the proof. It is first-party, genuinely useful, developmentally framed, and exactly the sort of thing a dietitian links to and an engine quotes. There should be thirty of these and there is one — while four hundred and seventy-five blog posts compete with each other for the same attention.
Not services yet — outcomes. Last time rankings moved and sales didn’t, so the measure matters as much as the work. Here’s what we’d hold ourselves to, and what we’d count as failure.
Most problem questions name nobody, so the target isn’t “win them” — it’s the five list-shaped ones that do, where you sit fourth at 44% behind ezpz and Stokke at 67%. In 90 days: be named in 6 of those 9 answers rather than 4, closing 44% toward 67%. Nine answers is a small base, so we’d report movement with its noise attached, not as a scoreboard.
Cutlery, cups and tableware are 0-of-3 losses today. These are attach products with a developmental story you own better than ezpz or Olababy do — and worth confirming against your own margin data, which we don’t have.
Eleven prompts where engines already disagree. The cheapest available wins, and the fastest signal that the work is landing.
Reddit, Mumsnet, the dietitian and OT blogs. Presence built on your first-party data and your existing expert network, not generic weaning content.
Your King’s Award, your named experts, your research. All real, none of it marked
up in the structures engines lift from. Starts with the entity itself — the
Organization block that currently says almost nothing about who
Bibado is.
AI share of voice, citation growth, AI referral traffic and attributable conversions — with the caveat that AI attribution is partial, stated up front rather than discovered in month four.
What these assume. Every number above is measured on work your team ships — the pages live and the developer tickets done by week six. If that slips, the clock moves with it and we will say so at the time rather than at the end. We would rather agree that now than argue it in month three.
And what would count as failure. If in 90 days AI presence has moved and revenue hasn’t, we’ll say so plainly and tell you why we think that happened. One honest limit on that promise: about a third of your business is Amazon and none of this measurement can see it. So we score on Shopify revenue plus the leading indicators we do control — presence on the tracked prompts, non-brand click-through against the position curve, citations earned — and we say now that a win landing on Amazon will look like a miss in our own numbers. Agreeing that is the difference between this and what happened last time.
Four workstreams. On every one Searchflex owns the thinking — the audit, the roadmap, the briefs, the measurement — while Bibado executes. Where your bandwidth runs out, you can hand a piece back to us. We’ll price whatever we agree, afterwards.
Not listed: CRO — for the reason given earlier. Worth a quarterly review, not a retainer.
You asked for rankings and got rankings. So before anyone signs anything, here is what the numbers actually support — and where they stop.
| If non-brand click-through moved from 0.26× of curve to… | Extra clicks a year | At £2.25 a session |
|---|---|---|
| 0.35× — modest | +4,453 | £10,000 |
| 0.50× — halfway to normal | +11,874 | £26,700 |
| 0.72× — parity with your own branded results | +22,758 | £51,200 |
Which is not, on its own, a reason to hire anybody. Recovering the entire click-through gap is worth something like £50,000 a year against organic revenue of £169,000. Real, worth having, and nowhere near enough to justify a serious programme. We would rather say that than build you a spreadsheet that reaches a million pounds by assuming its way there.
Three places, in order of size. Territory you do not currently occupy at all — the wider question universe rather than the 1.75m impressions you already have. Basket size, because the range is a developmental sequence and currently sells like a catalogue. And repeat purchase across that sequence as a child moves through it.
That any of this reaches seven figures. It might; the category is big enough and your authority is real. But nobody can model it honestly from here, and a plan that depends on a number we invented is exactly the plan that produced “rankings moved, sales didn’t”. Phase two exists to replace this arithmetic with evidence.
If the developmental sequence is real, it should show up in what people buy — not just in whether they find you. This is the part of the thesis that decides whether any of the rest is worth doing.
A customer who buys a £25 Coverall and stops is a different business from one who moves through the sequence. Coverall, then Dippit, then Handi, then Sippit, then the bowl — each at a developmental stage a few months apart. If the positioning works, it should widen baskets and bring people back. If it does not, it is a nice idea that does not pay, and we would want to know that early rather than at the end of a year.
| What we would measure | What it would tell you |
|---|---|
| Cross-category purchase rate | Whether the range sells as a system or as separate products |
| Products per order | Whether discovery converts into more than one thing |
| First to second purchase rate | Whether stage one earns stage two |
| Time between developmental purchases | When to be in front of a parent again, and with what |
| AOV, single-category vs multi-category | What the sequence is worth when it works |
| Twelve-month value by first product bought | Which entry point is worth acquiring, and at what cost |
We cannot calculate any of these today, and we want to be straight about why. GA4 gives us transactions and average order value by channel and nothing below it — no items, no baskets, no repeat behaviour. These six need Shopify order data, which we have not asked you for and would not assume. It is the first thing we would want in phase one, because it is the difference between measuring whether AI mentions you and measuring whether any of this made you money.
You have signed a long agency contract before and it did not end well. We would rather earn the right to scale this than ask you to take it on faith, so the structure puts a decision point in front of the money.
Foundation and specification. The entity block, the eleven orphaned collections, the thirty broken URLs, the template faults, answer architecture on the pages that already earn impressions — specified for your developers and QA’d on the way out. Plus the six strategy answers. Ends with a re-run of all 150 prompts as the starting baseline for phase two.
Execute the highest-confidence opportunities from phase one, across the consolidation work, the authority architecture and distribution. Measured on repeated runs with confidence bands, not one screenshot.
Six to twelve months, and only if the gate opens. If phase two shows movement in discovery but not in revenue, we would tell you that and propose stopping, not renewing.
“We’re the brain, your team does the doing” means our fee is not the programme’s cost. Add developer time for the technical work, a writer and your experts for the consolidation, and someone owning community and outreach. On any realistic shape that internal or freelance cost is comparable to our fee, sometimes larger. Judge the proposal on the total, because that is the number that has to earn its return.
It usually does, around month two. So we would rather agree a rate now for handing individual workstreams back to us than negotiate it under pressure later — and we would rather move the 90-day clock than pretend the work shipped on time when it did not.
The gate is a real one. At day 90 the question is not whether AI share of voice moved. It is whether more parents who did not already know Bibado found you, understood the developmental proposition, looked at more than one product, and bought. If that has not moved, the programme has not worked, and we will say so in those words.
Deliberately inverted from how agencies usually present this. The commercial line comes first because it is the one that decides whether to continue.
| Level | Measure | What it tells you |
|---|---|---|
| 1 | Revenue and repeat rate from non-brand discovery | Whether it worked |
| 2 | Qualified visits and multi-product exploration | Whether the right people arrived |
| 3 | Non-brand click-through against its own baseline | Whether we are being chosen |
| 4 | Citations earned in third-party sources | Whether authority is accumulating |
| 5 | Unprompted AI presence and threshold prompts | Leading indicator only |
One honest limit, restated because it decides how you read all of the above: roughly a third of your revenue is Amazon and none of this measurement can see it. A win that lands there will look like a miss in our numbers, and we would rather agree that now than argue it at the gate.
The right question, and the classic agency failure is that the answer differs. The people who built this analysis — the Search Console and GA4 joins, the prompt harness, the crawl, the corrections — are the people who would run Bibado. We will name them on the call and you should hold us to it. If we ever hand you to an account manager and a junior, that is a reason to leave.
Also fair, and we will bring what we have to the call: the baseline, what we changed, what happened to non-brand discovery, and what happened to revenue in absolute numbers rather than percentages. Where the work is close but not identical — this specific AI discipline is young enough that nobody has a decade of it — we will say so rather than stretch a case study to fit.
We would rather you tested us on a bounded piece of work than took our word for any of this. That is the whole reason phase one exists.
You told us last time you’d want to buy something small before committing to anything. That’s the right instinct and this is the shape of it — the work on this page that is already specified, already quantified, and doesn’t depend on a single new article being written.
Organization entity block, specified and QA’d/products/bamboo-bowls at 114,900 impressionsA dev-ready specification pack your developer can build from without us, QA on what ships, the re-measured prompt baseline, and the 90-day roadmap written off what we learn doing it.
It is specification and quality control, not implementation — your dev cost stays yours and stays visible. Four weeks, fixed scope, fixed fee. We’ll put the number to you on the call rather than on a web page.
Not homework — the things that decide whether the plan we write is the right one.
Around a third of your revenue is Amazon and invisible to GA4, so every pound figure here describes the two-thirds we can see. Content driving an Amazon purchase scores zero on this page.
If it logs the questions parents type, at the capture rate you quoted, it is the richest first-party source of customer language either of us will find. If it’s email capture, it isn’t. Worth five minutes to know.
The cutlery and tableware range is where AI is losing you most. Whether that’s where you want to grow is your call, not ours.
Dietitians, OTs, early-years specialists. Named authorship and co-signed research is a bigger asset than most brands have.
Who writes and publishes, and how much time they have. The consultancy model only works if the execution side is real, and we’d rather size it now than discover it in month two.
Search Console, GA4 and a Shopify theme preview. Nothing that changes anything — enough to write specifications against your actual templates rather than guesses.